To download the Microsoft Word Document with the images, click the following URL:
http://www.box.net/shared/t0p5hv90sh
Victoria (Canada, North America)
http://i122.photobucket.com/albums/o269/wendy3212/Victoria.gif
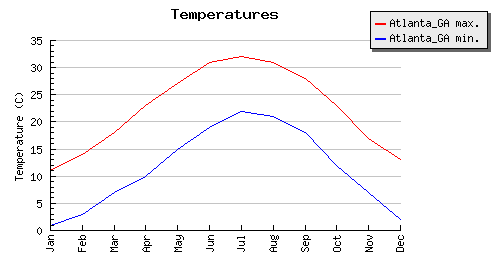
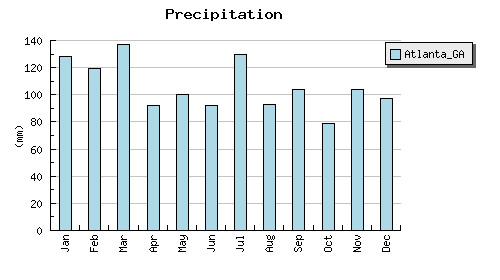
Atlanta (USA, North America)
http://i122.photobucket.com/albums/o269/wendy3212/atlanta_temp.png
http://i122.photobucket.com/albums/o269/wendy3212/atlanta_prep.png
Brazilia (Brazil, South America)
http://i122.photobucket.com/albums/o269/wendy3212/brazilia_temp.gif
http://i122.photobucket.com/albums/o269/wendy3212/basilia_prep.gif
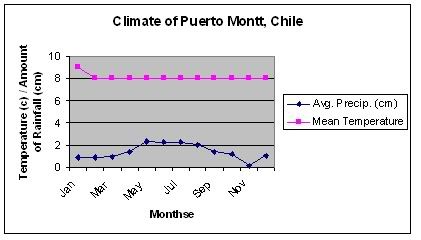
Puerto Montt (Chile, South America)
http://i122.photobucket.com/albums/o269/wendy3212/puerto_montt.jpg
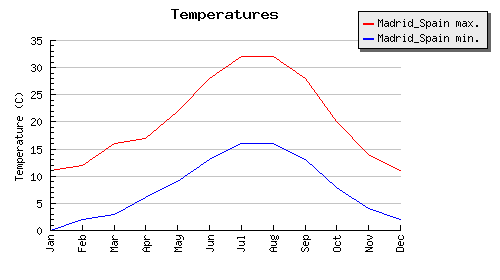
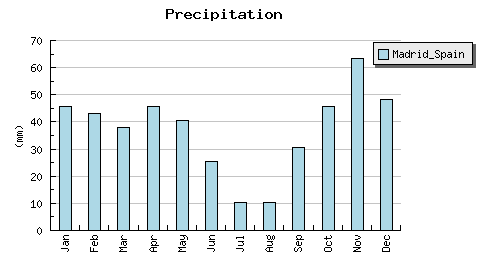
Madrid (Spain, Europe)
http://i122.photobucket.com/albums/o269/wendy3212/madrid_temp.png
http://i122.photobucket.com/albums/o269/wendy3212/madrid_prep.png
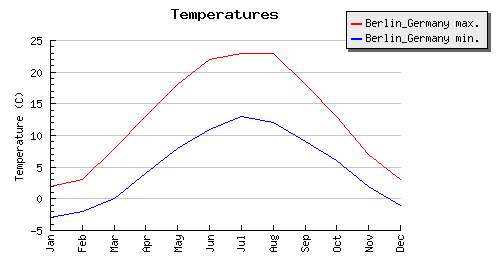
Berlin (German, Europe)
http://i122.photobucket.com/albums/o269/wendy3212/berlin_temp.png
http://i122.photobucket.com/albums/o269/wendy3212/brazilia_temp.gif
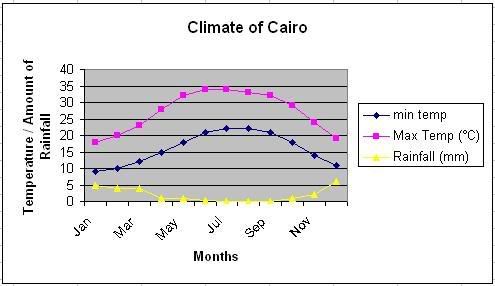
Cairo (Egypt, Africa)
http://i122.photobucket.com/albums/o269/wendy3212/Cairo.jpg
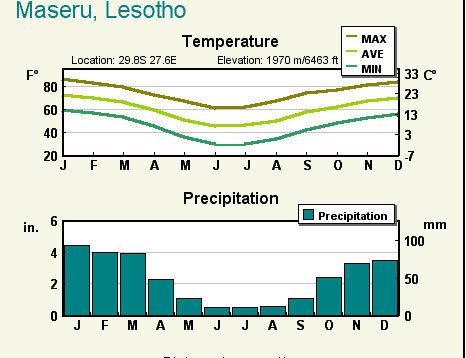
Maseru (Lesotho, Africa)
http://i122.photobucket.com/albums/o269/wendy3212/lesotho.jpg
Beijing (China, Asia)
http://i122.photobucket.com/albums/o269/wendy3212/china.gif
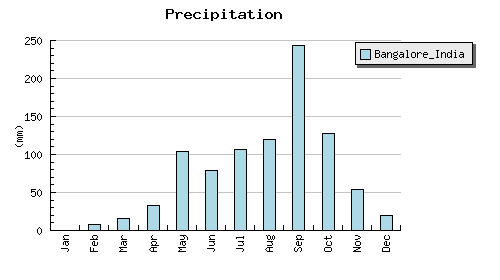
Bangalore (India, Asia)
http://upload.wikimedia.org/wikipedia/commons/f/f6/Bangalore_raintemp.png
Some things I noticed were that cities on the edge, near the ocean, have less range in temperatures, while cities inland have more range in temperatures. Also, cities in the southern hemisphere have completely opposite graphs than the ones in the northern hemisphere, due to the fact that their summer is in December and their winter is in July.
Climate Graphs of Cities Around the World
Sunday, May 20, 2007
Posted by Anonymous at 12:15 pm
Labels: Grade Eight, Social Studies
Subscribe to:
Post Comments (Atom)
0 comments:
Post a Comment